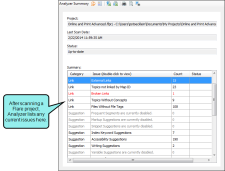
After opening a Flare project in MadCap Analyzer, the project is immediately scanned for possible issues, which are then listed in the Analyzer Summary window pane. From the Analyzer Summary window pane, you can double-click any of the issue rows. Doing this opens the appropriate window pane in the interface so that you can see more information about the reported issues and take action (e.g., fix broken links).
-
Open a project. When you do this, the Analyzer Summary window pane opens automatically, listing any issues in your project. You can also perform a manual scan of the project by clicking
 in the local toolbar.
This window pane displays the kind of issue that has been uncovered. It might be a "critical" issue displayed in a red font (such as a broken link or undefined style) that you should fix as soon as possible. Otherwise, it might be an "informative" issue (such as a suggestion for a new style), which might be a good change to consider, but not necessarily urgent.
-
Double-click any row to open the appropriate window pane to deal with the issue.
For example, if you double-click the broken links row, the Broken Links window pane opens. If you double-click the new style suggestions row, the New Style Suggestions window pane opens.
For a look at some of the main tasks that you can perform when dealing with current issues, see Key Features. For a complete list of what you can do in Analyzer, open the TOC (Help > Open Help) and open the Features link.
If you want to see all of the issues for a particular file, you can do so in the File Issues Viewer. See Viewing Issues for Specific Files.
