You can create a report based on the information captured while your project is being analyzed. When doing this, you can provide a name for the report and select the types of information that you want to include in it. Another option is to immediately print the report after it is generated. You can also design the look and feel of the report, and then compile it so that it displays the selected data in the format you provide.
[Menu Proxy — Headings — Online — Depth3 ]
How to Generate a Report
- Add or open a report file. The Report Editor opens. See Adding Report Files.
- Select the General tab.
- In the Title field, enter a title for the report you want to generate.
-
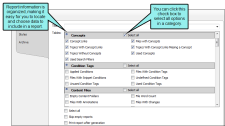
In the Tables section, click in the check boxes next to any information that you want to include in the report. Some items appear in multiple categories. Click the appropriate Select All check box to choose all items in a category.
-
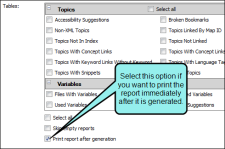
(Optional) Select Skip empty reports if you want to see only reports that contain information.
Example You are generating a report and have selected ten different types of information to include. Perhaps one of those types of information—"Unused Condition Tags"—will not return any results because all of your condition tags have been used somewhere. However, the other nine types of information do have data to report.
If you select the "skip" option, the generated report will include nine sections, one for each type of information containing data. You will not see a section in the generated report for "unused condition tags."
If you do not select the "skip" option, you will see ten sections in the generated result. Nine of those sections will show data, and the tenth (for "unused condition tags") will simply mention that no data exists.
-
(Optional) Select Print report after generation if you want to print a report immediately after you generate it. If this option is selected, the Print dialog opens as soon as a report is finished generating.
-
(Optional) If you want to modify the look of the report, use the following steps.
- Select the Styles tab.
- Select the style item that you want to modify (e.g., ReportEntry, ReportHeading, ReportText). You can select a basic style node, or you can expand the node and select an option under it.
- ReportEntry This affects the individual lines of data in a report, displaying the information you selected when generating the report. You can add borders, padding, and margins to those entries. Depending on the depth of the information in the report, the data may display on one of three levels. You can expand the style item and use the Level1, Level2, and Level 3 options to specify settings for each level.
- ReportGroup This affects the chunks or groups of data in a report, displaying the information you selected when generating the report. You can add borders, padding, and margins to those entries.
- ReportHeading This affects the individual headings that display in the report, based on the types of information that you selected when generating the report. For example, if you select four different types of data for the report (e.g., Absolute Links, Broken Links, External Links, Snippet Suggestions), you will see a different heading for each of those. You can change the heading label, as well as font, border, padding, and margin settings.
- ReportPrefix This affects the prefix text that is displayed before the individual lines of data in a report so that you know what you are looking at in an entry (e.g., File, Condition Tag, Link, Bookmark). You can change the font settings for those prefixes. Depending on the depth of the information in the report, the data may display on one of three levels. You can expand the style item and use the Level1, Level2, and Level 3 options to specify settings for each level.
- ReportSection This affects the entire section where a type of information is displayed in a report. For example, if you selected to view absolute links and external links in a report, you can modify the section for each, to change the look of the area where the heading and individual entries are shown. You can add borders, padding, and margins to those sections. You can also specify that a page break should be inserted before or after the heading in a report.
- ReportText This affects the text of the individual lines of data in a report. You can change the font settings for the text. Depending on the depth of the information in the report, the data may display on one of three levels. You can expand the style item and use the Level1, Level2, and Level 3 options to specify settings for each level.
- Select the Property Groups or Alphabetical List option to display the properties for the style item.
- In the Properties section, set the values for the properties that you want modify.
- Click
 to save your work.
 - Select the General tab.
- In the Report section, click the Generate button. The report is generated and displays below. If you change the options and click Generate again, the report will be replaced with a new one.
What’s Next?
After generating a report, you may want to do either of the following.


