Text Analysis
From the Tools ribbon in Flare, you can run text analysis on content files for readability, average sentence length, and more.
How to Run a Text Analysis
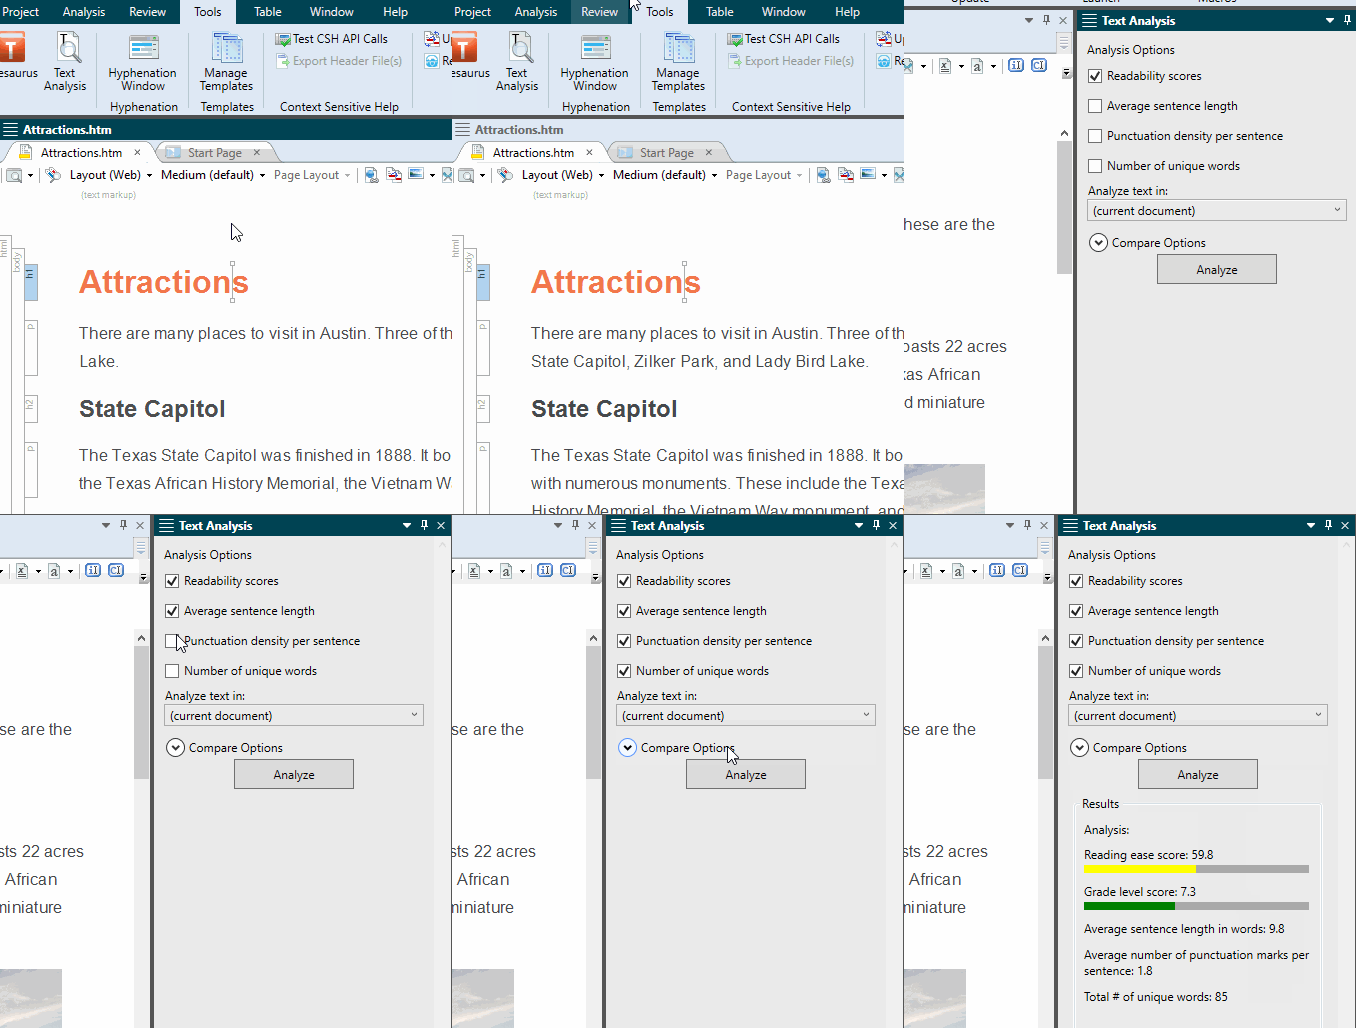
- Open the content file.
- Select Tools > Text Analysis.
- Select any of the options to include in the analysis.
Readability scores This lets you know how easy or hard it is to read your documents. Scores are based on “The Flesch Reading Ease” and “Flesch-Kincaid Grade Level” tests. For Reading Ease, a higher score indicates that the text is easier to read and a lower score means it is harder to read. The Flesch-Kincaid Grade Level is based on grade levels in the United States educational system (e.g., a score of 6 means a 6th grade reading level).
For more information about these tests, see:
Copyhttps://readable.io/content/the-flesch-reading-ease-and-flesch-kincaid-grade-level/- Average sentence length This lets you know how many words are in the average sentence.
- Punctuation density per sentence This lets you know the average number of punctuation marks in each sentence.
- Number of unique words This provides you with a basic vocabulary count. It lets you know how many words are used in the document(s), but it does not count any word more than once.
Analyze text in Select which document(s) you want to include in the analysis:
- current document Flare analyzes the active file only.
- pick a file A dialog opens that lets you choose any topic, snippet, template page, or micro content file.
- documents in the same folder Flare analyzes all files located in the same folder as the current one.
- all open documents Flare analyzes all files that are currently open in the project.
- pick a folder A dialog opens that lets you choose any folder in your project. Flare will then analyze the files within that folder.
- whole project Flare analyzes every file in the project.
Compare text in This lets you perform a side-by-side comparison of the document(s) originally selected above with other documents. Choose the second document (or group of documents) to include in the comparison.
When the selected analysis option is part of the group being compared (e.g., whole project, documents in same folder), results are not included for those files. Results are included only for the other documents being compared.
-
Click Analyze. Results are shown in the space below.
Colored bars are used to indicate whether an area has a good (green), average (yellow), or poor (red) score. Remember that reading ease and grade level results are the opposite of one another. That is why you would see a high reading ease score with green bar but a high grade level score with a red bar; that’s because you want to see high scores with reading ease, but low scores are preferable for grade level.
If the animation below is cut off, you can see the complete animation by clicking the link under it to open the full topic.
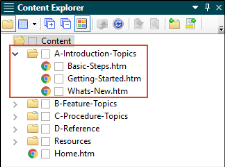
Example You have a folder in your project containing three topics: Basic Steps, Getting Started, and What’s New.
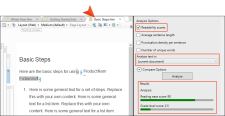
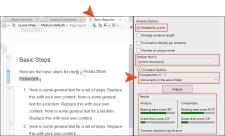
You want to analyze these topics for their readability scores. If you analyze the topics one at a time, you’ll see that the Basic Steps topic has the following results
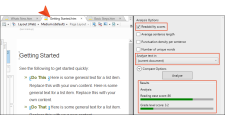
The Getting Started topic has these results:
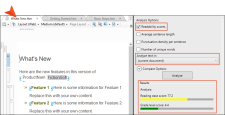
And the results for the What’s New topic look like this:
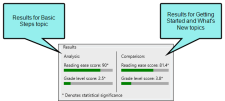
Then you decide you want to compare the results for the Basic Steps topic next to the other two. So in the Compare text in field, you select (documents in the same folder) and run the analysis. The results look like this:
The results on the left are for the Basic Steps topic. The comparison results on the right are a composite of the Getting Started and What’s New topics.
Although the Basic Steps topic is included in the same folder as the other two, it doesn’t make sense to include that topic in the second set of results, because that is the topic you are comparing the others to.
