Analyzer's workspace is flexible, uses a modern Multiple Document Interface (MDI), and gives you several options to work the way that you want.
The user interface consists of the following major sections.
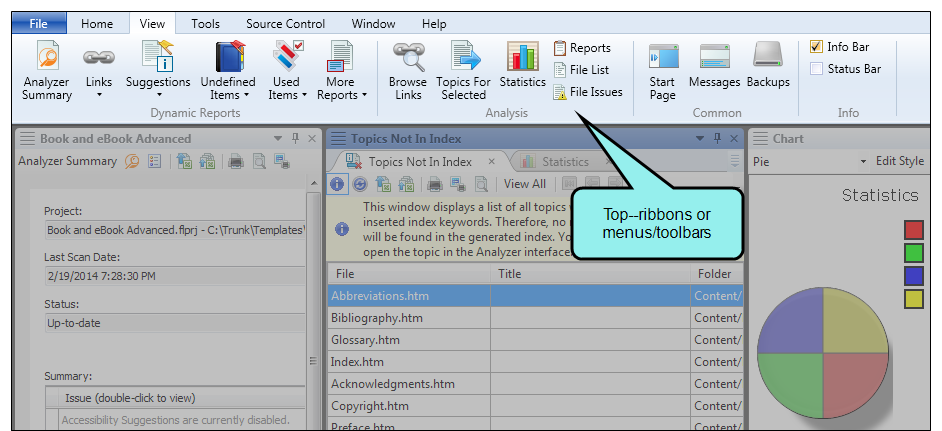
- Top The top portion of the Analyzer interface displays either a ribbon view, or a tool strip view, which are used to access features.
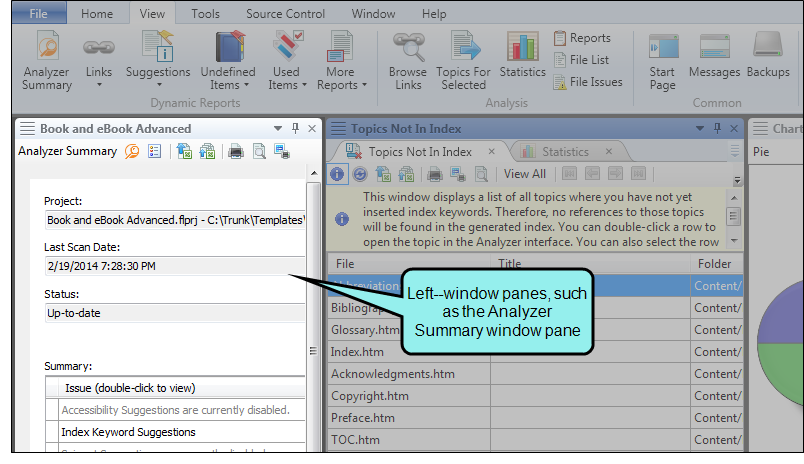
- Left The left side of the interface is the default location for the Analyzer Summary window pane, which is the primary window pane in the interface. This window pane displays a list of current issues in the project being analyzed. The left side is also the default location for other window panes, such as the File Issues Viewer.
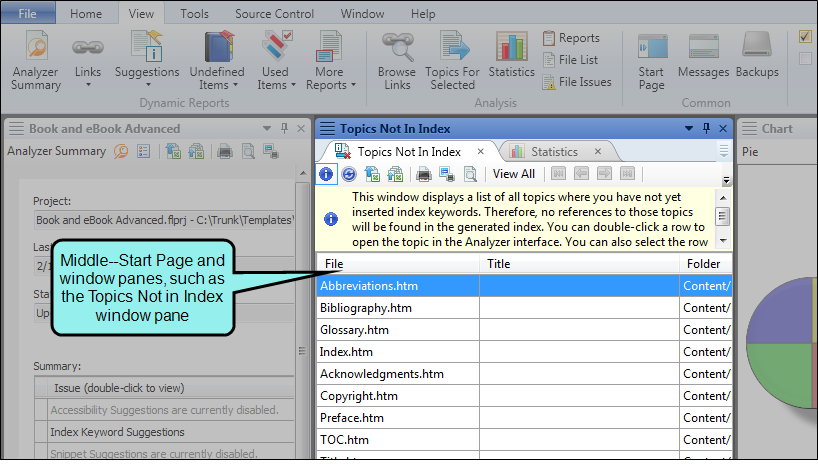
- Middle The middle section of the interface is the default location for many different window panes (e.g., Statistics window pane, Broken Links window pane, Snippet Suggestions window pane), which can be used to view and work with information about your Flare project. The middle section can also display a variety of editors used for modifying content, as well as the Start Page, which is used for quickly performing high-level tasks and accessing information.
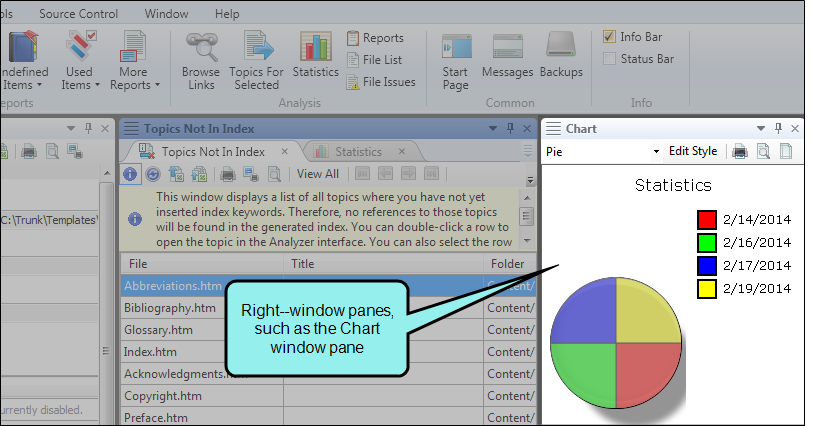
- Right The right side of the interface is the default location for other window panes (e.g., Incoming Links window pane, Chart window pane).
You have the flexibility to close or move elements around as you like, so it is not mandatory that every window pane remain permanently in its default location.
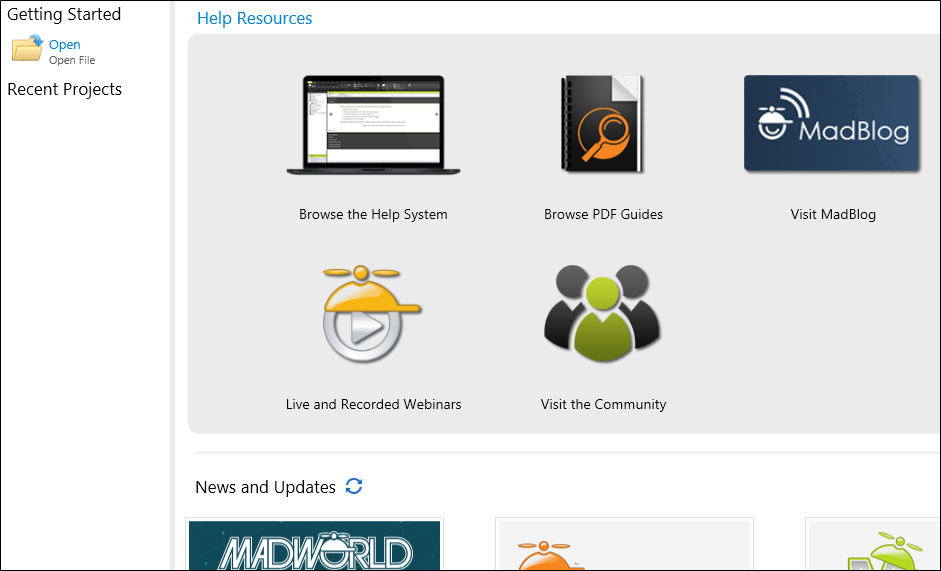
The Start Page is a handy window pane that displays when you first launch Analyzer and remains open unless you close it. You can use the Start Page to open and create projects, access Getting Started resources for new users, select project templates, and more.
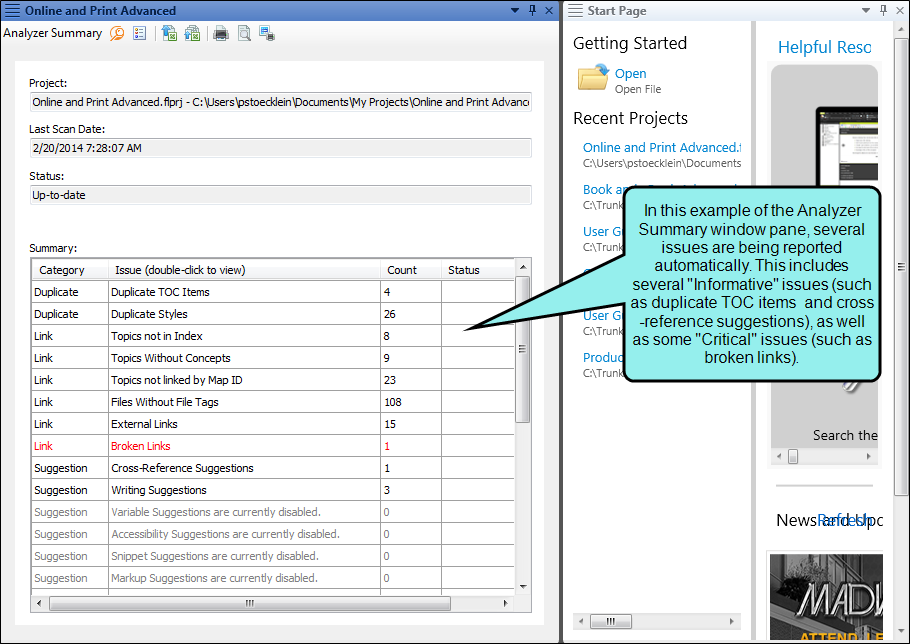
The Analyzer Summary window pane is the primary window pane in the interface. This window pane displays a list of current issues in the project being analyzed. You do not need to do anything to populate this window pane. After you open a project, it is automatically scanned and the results are shown. For example, if you have 30 broken links in your project, this will be noted in the Analyzer Summary window pane. You can then double-click an issue to open the appropriate window pane pane (e.g., Broken Links window pane), which lets you see more information and deal with the issue.
Analyzer has numerous window panes in the interface that are used for a variety of purposes. Some of these panes are located by default on the left side of the workspace, some on the right side, some in the middle, and some at the bottom. If more than one window pane is open on either side, the panes are organized in an accordion or tab structure. This means that they are stacked on top of each other, with the active window pane displayed "in front" of the other panes. You can click any accordion bar or tab to bring that particular window pane "in front" so that you can work in it.
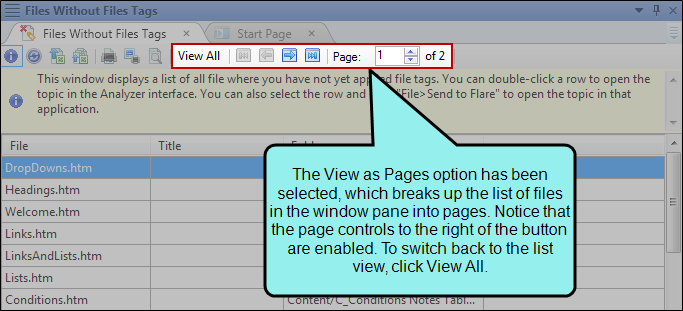
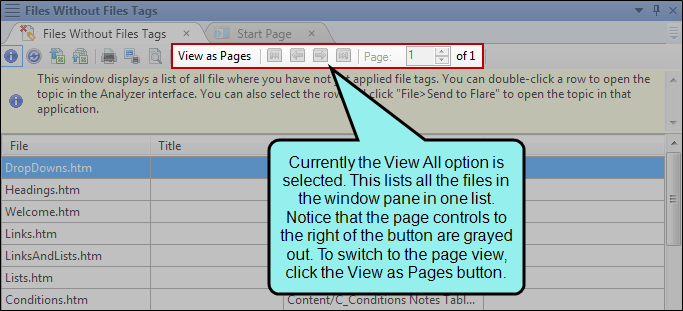
Most window panes have two different options for viewing content. These views can be toggled by clicking the View All/View as Pages button in the local toolbar. The button displays the opposite of whatever view is currently activated (e.g., if the View All option is active, the button shows View as Pages to indicate that, if clicked, the button will switch the window pane to the View as Pages option).
This option displays the first 100 items before switching to a paginated view with using navigation controls.
This option displays all items in the window pane at once in a long list.
By using the CTRL+TAB and CTRL+SHIFT+TAB shortcuts, you can easily switch between elements in the user interface. This opens a popup displaying icons of the various files and window panes that are currently open in the user interface. Therefore, you can easily move from element to element. By pressing CTRL+TAB, you can tab forward through the icons. By pressing CTRL+SHIFT+TAB, you can tab backwards through the icons. When you release the keys, the element associated with the selected icon opens.
Each open document in the workspace has a tab or accordion that lets you access it. The most recently opened document is in front, while other open documents are behind it. You can bring a document into view by clicking its tab.
You can also work with these document tabs in the following ways.
You can click and drag tabs to the right or left to change their order.
You can choose how to view window panes in the workspace.
- Accordion tabs Stacks the document tabs below the window pane or editor.
- Standard tabs on top Places the document tabs on the top of the window pane or editor.
- Standard tabs on bottom Places the document tabs on the bottom of the window pane or editor.

To switch between tabs, right-click in the title bar of the window pane or editor and select a view.

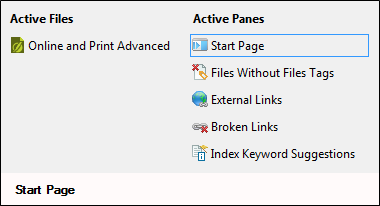
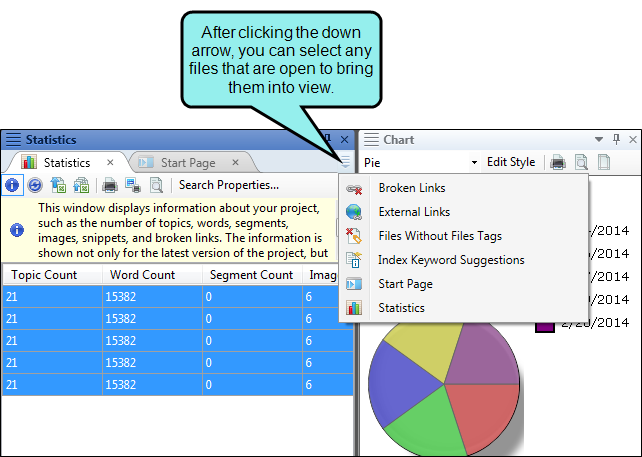
You can open as many files as you need in the interface. When you have opened more files than can be shown, the hidden files can be accessed by clicking a drop-down menu on the right side of the workspace.
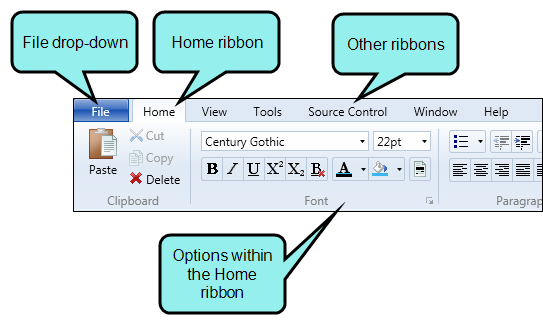
Analyzer's user interface lets you use a ribbon layout, or the more traditional tool strip layout.
The ribbon layout consists of a File drop-down with common tasks such as initiating a project analysis, opening files, and saving documents. This is followed by the Home ribbon, which is the default, and several others related to various features in Analyzer.
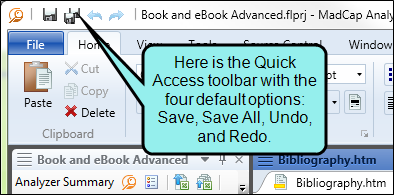
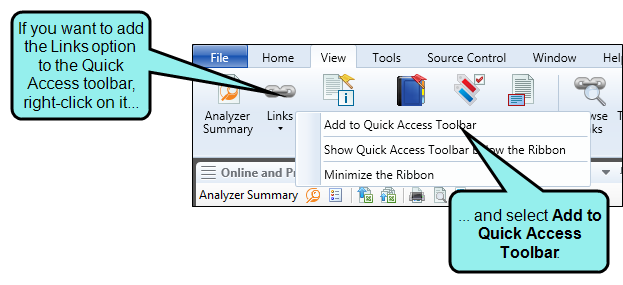
The ribbon view also lets you take advantage of the Quick Access toolbar, which lets you add your favorite ribbon options to it.
Analyzer's user interface includes a menu bar at the top of the program window, containing several menu options.

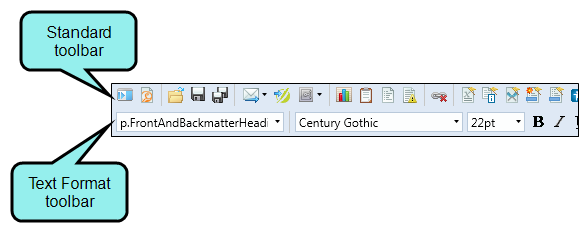
Analyzer has multiple global toolbars ("global" meaning they are always available at the top of the user interface, regardless of the type of document, editor, or window pane you are working on at the moment).
There are two kinds of global toolbars—Standard and Text Format.
Ribbons can be seen only if you are working in the ribbon view, and menus and toolbars can be seen only if you are working in the traditional tool strip view. You can use the Options dialog to switch between ribbons and the classic tool strip layout.
These are toolbars that are intended for a particular window pane. For example, the Statistics window pane contains a local toolbar that includes a shortcut button for sending data to the Chart window pane, because the Statistics window pane is where you would use that feature (as opposed to, say, the Snippet Suggestions window pane). Most window panes in Analyzer contain a local toolbar.
For example, this is the local toolbar from the Statistics window pane:
