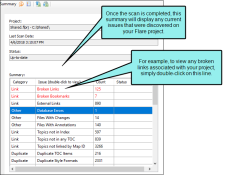
The Analysis Summary window pane displays current issues for the project that you are analyzing. Issues might be critical problems (e.g., broken links) or simply information that can be used for improving the project (e.g., new style suggestions). After the analysis tool finishes scanning your project and displays the current issues, you can double-click on a row to the open the appropriate window pane and take action. See Viewing Current Issues.
Here is an example of some current issues listed in the Analysis window pane.
[Menu Proxy — Headings — Online — Depth3 ]
How to Open This Window Pane
Select the Analysis ribbon and click Summary.
Buttons and Sections
|
Option |
Description |
|---|---|
|
|
Scans your project so that the latest current issues are displayed in the Summary window pane and the most recent information is shown in other window panes in the application. |
|
|
Opens the advanced scan options dialog, which lets you enable or disable the collection of different types of information when your project is scanned for possible issues and problems. Also, by disabling scans, you may find that your system performance is improved somewhat. See Enabling Analysis Scans. |
|
|
Exports all the data in the window pane to a CSV file. |
|
|
Exports selected data in the window pane to a CSV file. |
|
Project |
Displays the name and path of the project that you are scanning. |
|
Last Scan Date |
Displays the most recent date and time that your project was scanned. |
|
Status |
Displays the status of a scan on your project (e.g., "Scanning," "Up-To-Date"). |
|
Summary |
This section displays any current issues that the project analysis module has found after scanning your project. From the Summary window pane, you can double-click any of the issue rows. Doing this opens the appropriate window pane in the interface so that you can see more information about the reported issues and take action (e.g., fix broken links).
|


