Select View>Topics.
The Topics window pane opens.
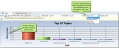
A chart is displayed in the window pane, with the data shown below in a grid.
- Path Displays the location of the topic.
- Title Displays the properties title of the topic.
- View Count Displays the total number of times the topic has been viewed.
- Comment Count Displays the total number of comments.
- Avg Rating Displays the average rating for the topic, taking into account all rating scores received for that topic.
- Rating Count Displays the total number of ratings that have been submitted.

- In the local toolbar, click
 .
. - In the Date Filter dialog, click Enable filter.
- Select either Range or Preset.
- Click in the appropriate fields to select a timeframe. If you use the "Range" option, you can click on the down arrows to choose specific months and dates. You can also click inside the field and type a different time.
- Click OK.
(Optional) You can limit the columns of information to be included in the grid and chart. To do this, complete the following steps.
- In the local toolbar, click
 . The Options dialog opens.
 - Click Show for each piece of data you want be displayed in the grid.
- Click OK.
(Optional) You can change the type of chart shown. To do this, click the chart type filter field in the local toolbar and make a selection. Initially this field displays the type of chart currently used (e.g., "Bar" or "Pie"), but the label changes with each selection you make.


Following are the options you can choose:
- Selected Rows Only the selected rows of data are included in the chart. If you want to use this option, you can select multiple rows in the grid by holding down the SHIFT or CTRL key and clicking a range of rows or individual rows.
- Top 10 Only the first 10 rows of data are included in the chart.
- Top 25 Only the first 25 rows of data are included in the chart.
- Top 50 Only the first 50 rows of data are included in the chart.
- Custom Only the first number of rows that you specify are included in the chart. When you select this option, the Custom Data Filter dialog opens. Enter the number of rows to be shown and click OK.
- View Count
- Comment Count
- Avg Rating
- Rating Count
In most types of charts this information is displayed on the left side of the chart.

 in the local toolbar.
 See Also