The Content Services Portal is used to manage search indexes on your Elasticsearch output. You can review and manage search indexes by topic, micro content, user searches, and global searches.
[Menu Proxy — Headings — Online — Depth3 ]
How to Access the Production Content Services Portal
Installation and configuration of the Content Services Portal results in a URL for the portal. To access Content Services on the production server, you can enter the URL into a web browser. For example, the URL to use from another computer to access this portal is http://[name of server]/[MyPortal].
How to Access the Local Content Services Portal
The following steps describe how to open the local version of Content Services. You might want to do this to test the portal locally.
- Open a project.
- Open an HTML5 target that has been built using Elasticsearch as the search engine.
- Click the Search tab.
- After all of the settings have been configured for Elasticsearch, click the Launch Content Services button.
Managing Search Indexes
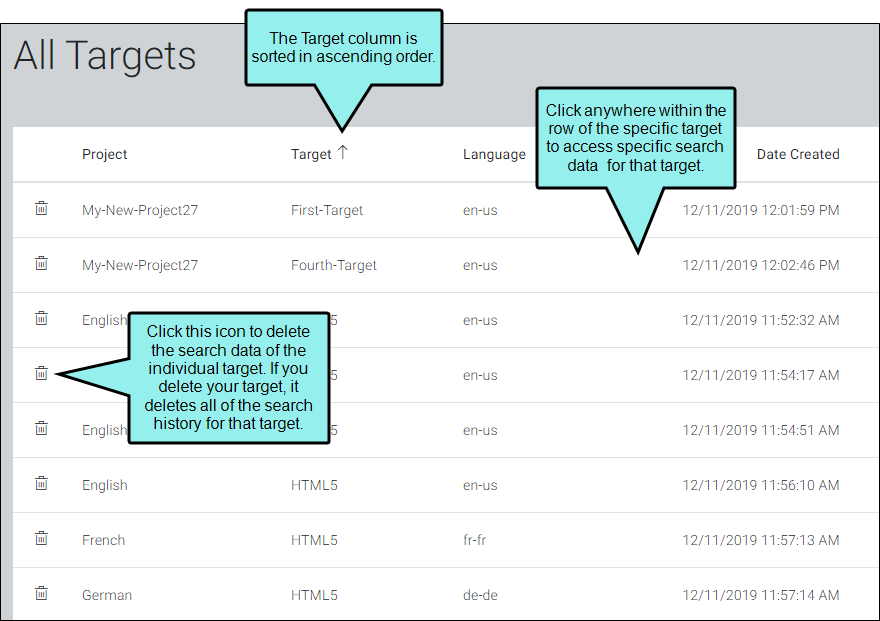
The All Targets window displays all HTML5 targets using Elasticsearch. You can access search data by an individual target. Each of the columns on this window can be sorted in ascending or descending order by clicking on the column name.
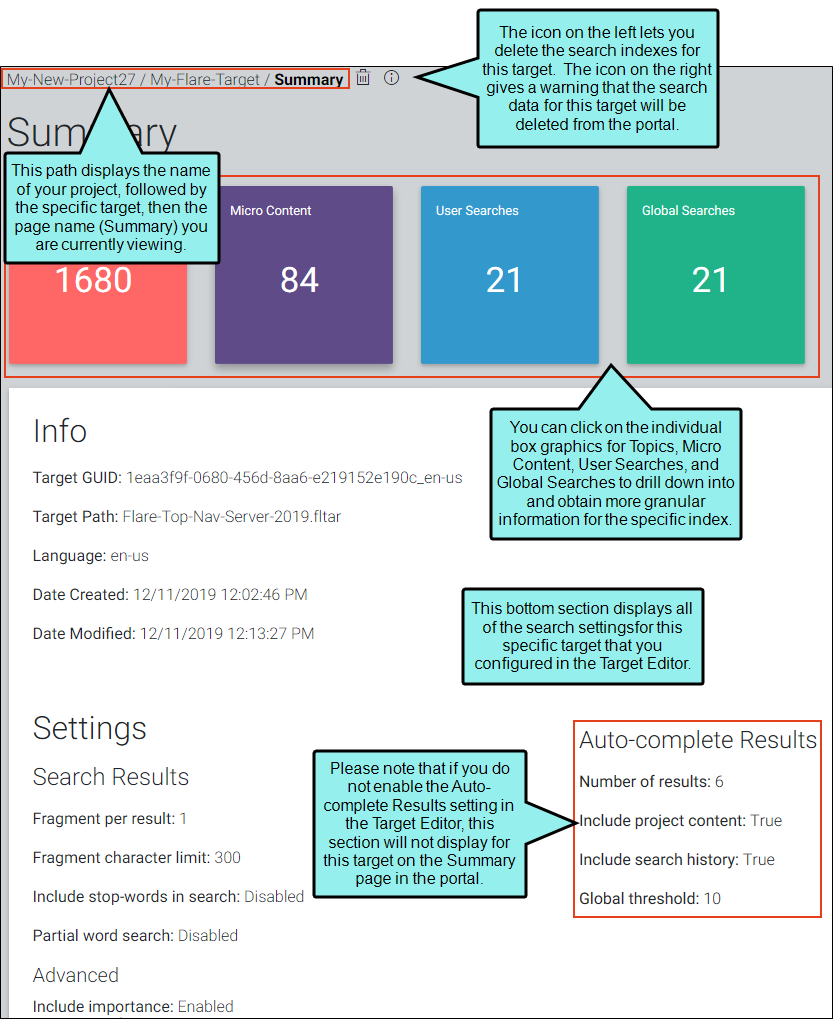
When you click an individual target, the Summary window is displayed for it. This window shows the total number of searches done, number of files that can be searched, and users that have searched on the individual target. The bottom half of this window displays the settings you configured for your Elasticsearch output.
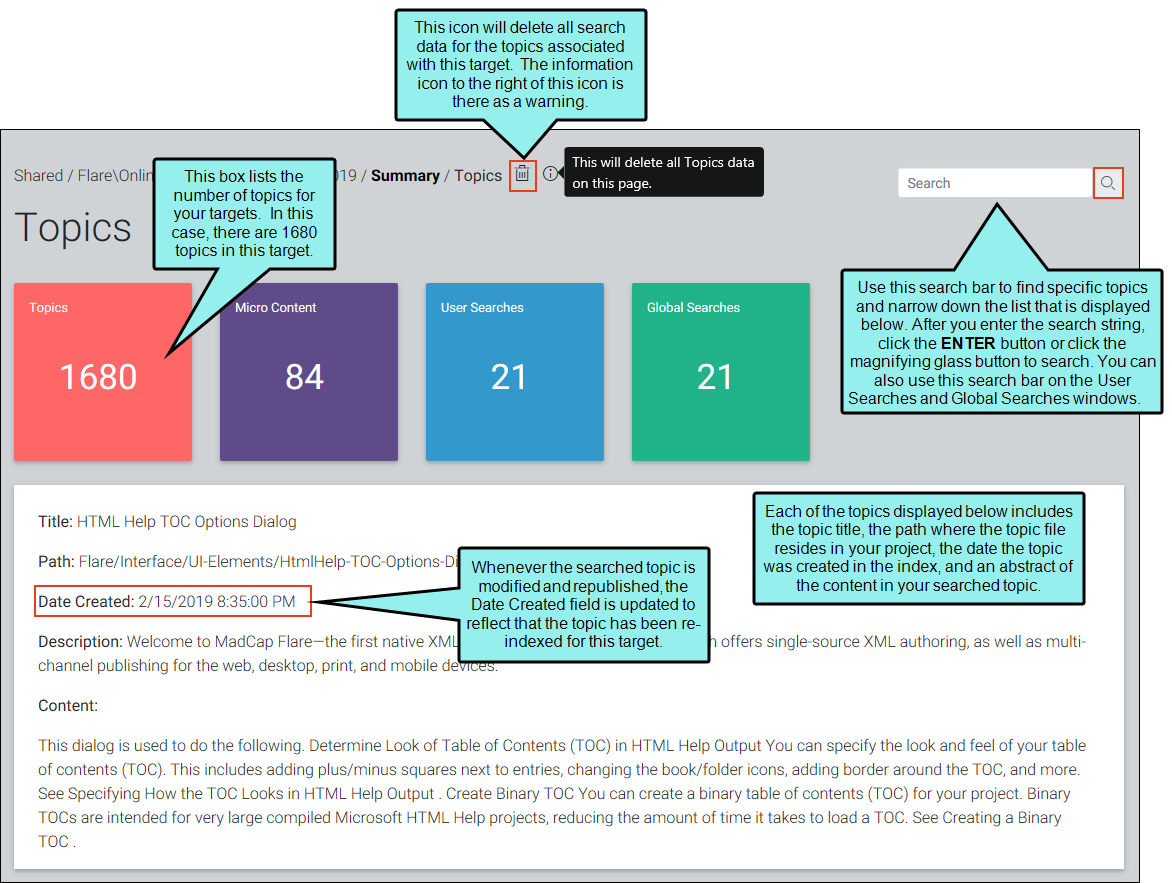
If you click the red Topics button in the top left corner, the Topics window displays the total number of files searched on this target. You can enter a string in the search field to filter the list of files displayed.
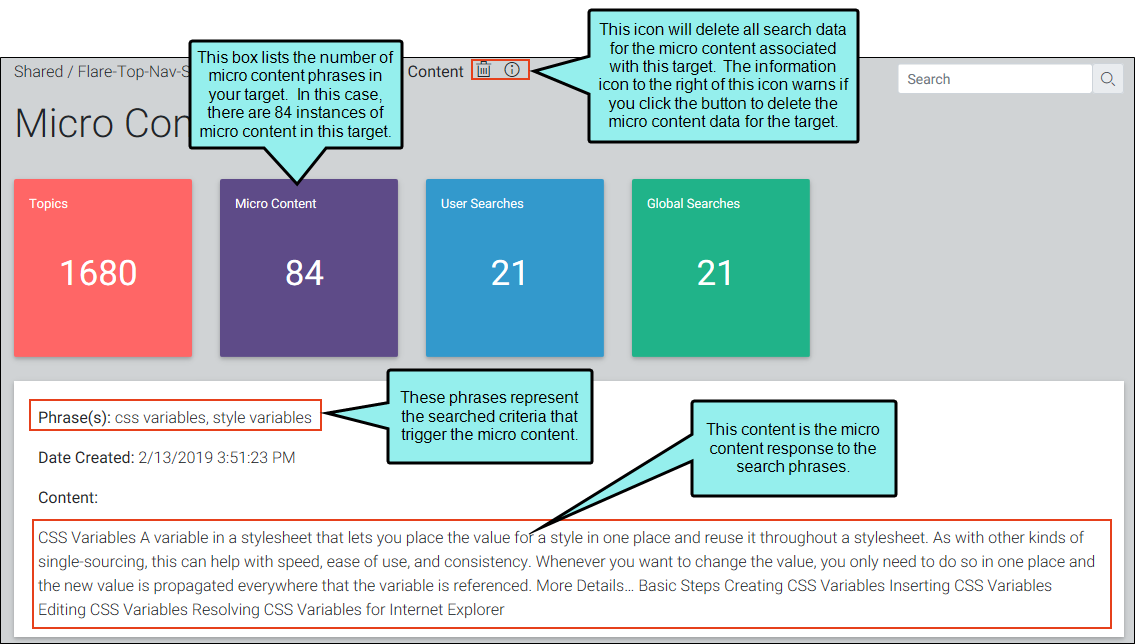
When you click the purple box in the portal, the Micro Content window displays all of the phrases and the corresponding content that responds to each phrase. Each box in this window contains the phrase, the date the micro content was created, and its corresponding response.
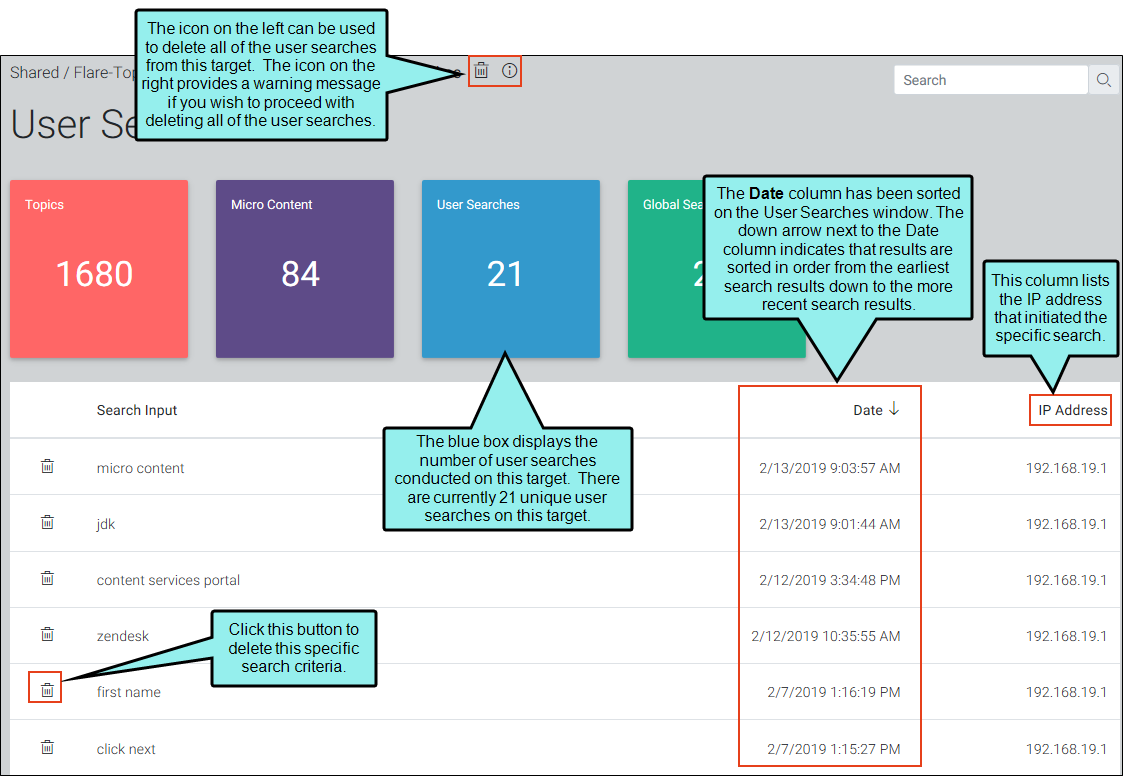
Clicking the blue button displays the number of user searches for the specific target. This window displays the search criteria from each individual search, the date of the search, along with the IP address of the user who conducted the search. Each of the columns can be sorted in ascending or descending order by clicking on the column name. You have the option to delete individual search criteria, or delete all of the individual user searches for your target.
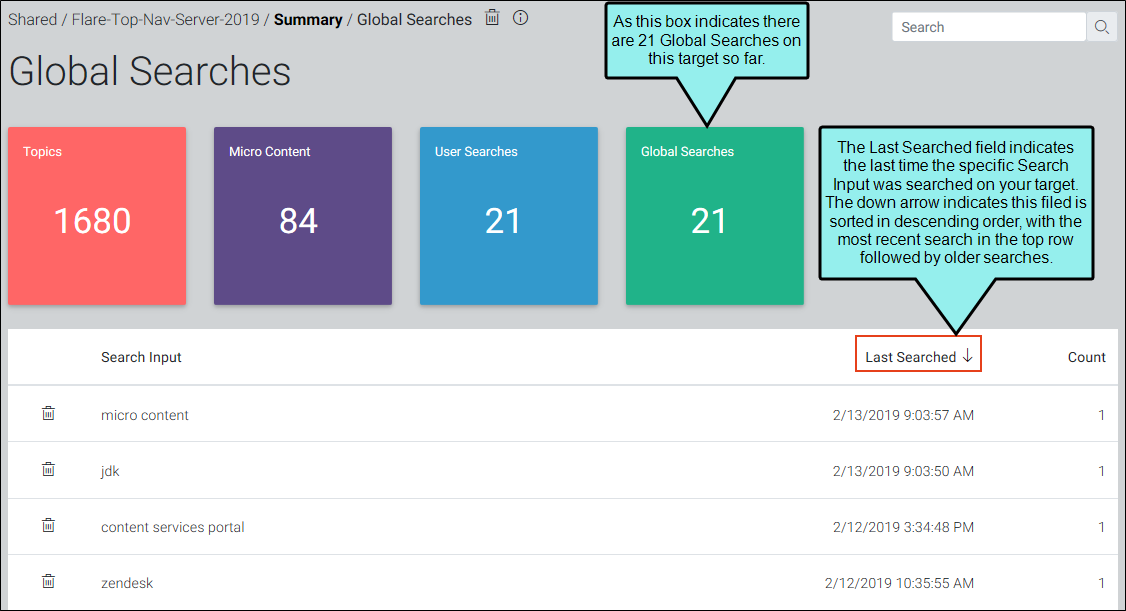
The Global Searches window is displayed when you click the green button labeled Global Searches anywhere in the portal. The Global Searches window shows each search criteria, the last time that criteria was searched, along with the number of times that particular search string has been searched for your Elasticsearch output. The number displayed in the Search Count field increments higher when a specific string is searched by different IP addresses. So if the same IP address has searched a certain search string multiple times, the search count number does not increment higher for that particular IP address. Each of these columns can be sorted in ascending or descending order by clicking on the column name.
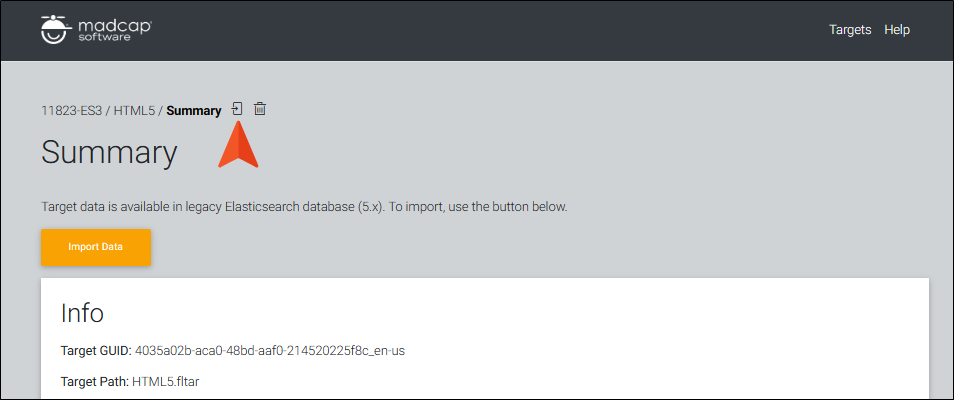
Importing Data From an Upgrade
If you are upgrading Elasticsearch from 5.6 to 7.10.2, you will see a large Import Data button in the portal after you open a target.
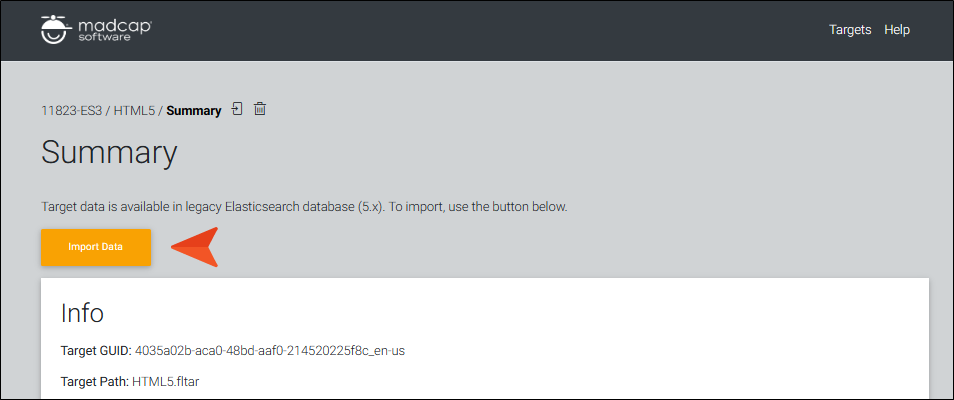
Note If you have do not yet have data for Elasticsearch 7.10.2, you should see the large Import Data button. This button will go away after your first import. There is also a smaller import button at the top of the portal.