You can use various tools to analyze project source files for issues, and view user activity on output.
[Menu Proxy — Headings — Online — Depth3 ]
Analysis on Source Files
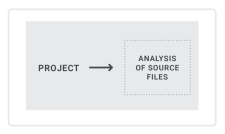
No setup is needed for analysis of source files. You simply run scans on your project.
Analysis Ribbon
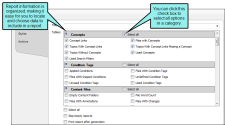
From the Analysis ribbon in Flare, you can scan files and run reports to discover a wide variety of information. This includes broken links or bookmarks, files with changes, topics not in a table of contents (TOC), used meta tags, and more.
Reports
From the Reports folder in the Project Organizer, you can generate custom reports based on information contained in your project. In addition, you can design the look and feel of reports, save them for future access, and open them in a browser window (where you can print them).
Text Analysis
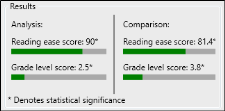
From the Tools ribbon in Flare, you can run text analysis on content files for readability, average sentence length, and more.
Analysis on Output Files
By collecting information about how people are using your output, you can more effectively make decisions to improve the content.
MadCap Central Analytics
If you have a MadCap Central license, you can view analytics on published Flare HTML5 output. This includes search phrases used, search phrases with no results, topics viewed, context-sensitive Help calls, and demographic statistics (browsers and operating systems). See Central Analytics.
The process is quite simple. You create an analytics key in a couple of steps, associating it with a target. Then after building and publishing your output, you use the Analytics page on Central to view user activity on the output as it occurs.
Central analytics works on Flare projects uploaded to Central, or you can host output on your own servers. If you host the output outside of Central, you still need to use Central with a key to view the analytics data. Also, the server where the output is hosted must be able to communicate with Central (e.g., not be behind a firewall).
MadCap Content Services
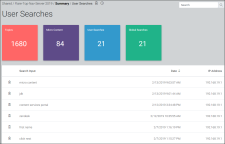
The Content Services Portal is used to manage search indexes on your Elasticsearch output. You can review and manage search indexes by topic, micro content, user searches, and global searches.
Google Analytics
You might decide to use Google Analytics (or another third-party tool) for reporting activity on your output. If you have a Google Analytics account, you can obtain a tracking code, which you can then add to your template page(s) in a Flare project. After publishing the output, you can use the Google Analytics website to see various reports about your output. For more information, please refer to the Google Analytics website.
Syndicate Analytics
If you publish output files to a Xyleme Syndicate destination, you can use the analytics that are built-in to the application. Since Syndicate was designed primarily for learning and development (although it also hosts technical documentation), its analytics centers on tracking user interactions with content. It can track how users consume content such as individual topics or videos. For eLearning it can manage millions of records in its built-in learning record store (LRS). See
Note If you are interested in learning more about Syndicate, contact MadCap Sales. They can provide information about the product, demos, review purchase options, and set up Syndicate accounts.


